FlashX is designed for a large parallel machine with fast SSDs, but it also runs efficiently in the cloud environment. Here we evaluate the performance of FlashX in both high-end servers and the Amazon cloud. The table below shows the hardware configurations where FlashX is evaluated.
| i2.xlarge | i2.8xlarge | HW1 | HW2 | |
|---|---|---|---|---|
| #CPU cores | 4 | 32 | 32 | 48 |
| RAM (GB) | 30 | 244 | 512 | 1024 |
| #SSDs | 1 | 8 | 15 | 24 |
Speed of FlashX
Graph analysis
We first evaluate the performance of FlashGraph on the Twitter graph (42 millions vertices and 1.5 billion edges), as shown below. We choose the Twitter graph for performance evaluation because this graph is commonly used by many graph processing frameworks for performance evaluation. We run multiple graph algorithms: breadth-first search, triangle counting, weakly connected components and pagerank. The twitter graph is relatively small and all of the hardware has enough RAM to keep the entire graph in memory. In this experiment, FlashGraph uses a small page cache (1 GB) and reads data from SSDs. FlashGraph only uses a small fraction of the RAM in the machines. Keep in mind that FlashGraph runs much faster if we use a larger page cache size.
| i2.xlarge | i2.8xlarge | HW1 | HW2 | |
|---|---|---|---|---|
| BFS | 36.86 | 5.48 | 3.56 | 3.11 |
| PageRank | 438.74 | 67.34 | 54.07 | 33.58 |
| WCC | 58.90 | 7.91 | 7.91 | 5.03 |
| Triangle | 4747.07 | 830.08 | 532.21 | 442.65 |
| SCC | 141.62 | 22.39 | N/A | 12.06 |
Table 2. The runtime (seconds) of FlashGraph on the Twitter graph when running on different hardware with 1GB page cache.
FlashGraph vs. Giraph, GraphX and PowerGraph
For comparison, we pull performance results of distributed graph engines from the GraphX paper. The paper don’t have performance results of all of the graph applications we evaluated. Therefore, we only compare their performance in PageRank and weakly connected components. Giraph, GraphX and PowerGraph were evaluated in 16 m2.4xlarge instances, which each has 8 CPU cores and 68GB RAM. Only PowerGraph is a little faster than FlashGraph in PageRank when FlashGraph runs in a small Amazon instance.
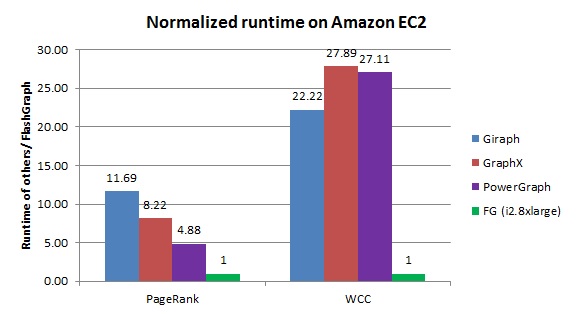
Figure 1. The runtime of graph engines normalized to FlashGraph when processing the Twitter graph in the Amazon cloud.
Given such performance results, we can further demonstrate that FlashGraph is much more economical than distributed graph engines in the Amazon cloud. m2.4xlarge is the previous-generation instance type. A similar instance (m4.2xlarge) of the current generation has cut the price almost by half and we use the cost of m4.2xlarge for the calculation. Figure 2 shows the runtime dollars (=runtime * instance cost) of the graph engines in the cloud. When comparing these graph engines with this metric, FlashGraph in i2.xlarge is the most economical. These distributed graph engines are one order of magnitude more costly than FlashGraph in the cloud.
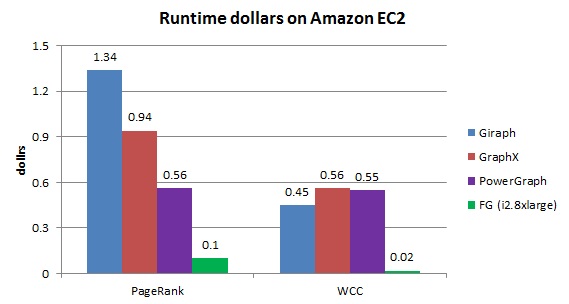
Figure 2. The runtime dollars (=runtime * instance cost) of graph engines on the Twitter graph in the Amazon cloud.
Machine learning
FlashR provides very fast matrix operations to run machine learning algorithms efficiently. Furthermore, FlashR provides high compatibility with the R base package to execute existing R implementations of machine learning algorithms. We evaluates the performance of FlashR with a large set of algorithms, ranging from basic operations (building blocks for machine learning, e.g., cross product and SVD) to implementations written from the scratch (correlation, k-means, GMM) to implementations adapted from existing R libraries (LDA, ). FlashR supports both in-memory and external-memory execution, so we will show both in-memory and external-memory performance.
FlashR vs. RRO
We compare the performance of FlashR with RRO with the RRO benchmark and show that FlashR can significantly outperform RRO in HW2. FlashR parallelizes all matrix operations, while RRO can only parallelize matrix multiplcation with Intel MKL. As such, when the algorithm becomes more complex, the speed gap between FlashR and RRO gets larger.
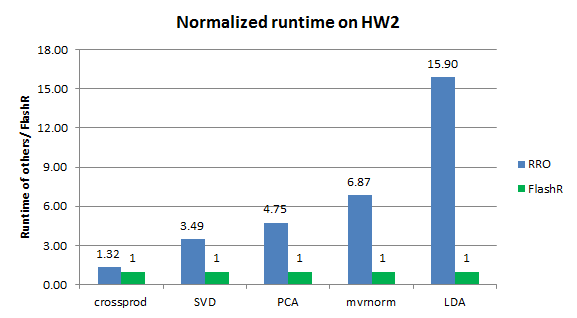
Figure 3. The normalized runtime of FlashR vs. RRO on a matrix with 1 million rows and 1000 columns when running on HW2.
FlashR vs. Spark
We measure the performance of FlashR and Spark on a dataset with 1 billion data points and 32 features. The FlashR implementations outperform the ones in Spark MLlib by almost an order of magnitude in the parallel machine (Figure 4). Given fast SSDs, FlashR executes these implementations on SSDs with the speed comparable to in-memory execution. Given the small memory consumption of FlashR in the external-memory mode (Figure 5), we demonstrate that FlashR can scale to very large datasets easily.
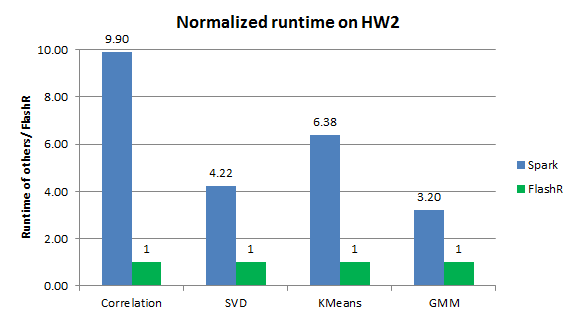
Figure 4. The normalized runtime of FlashR vs. Spark MLlib on a dataset with 1 billion data points and 32 features when running on HW2.
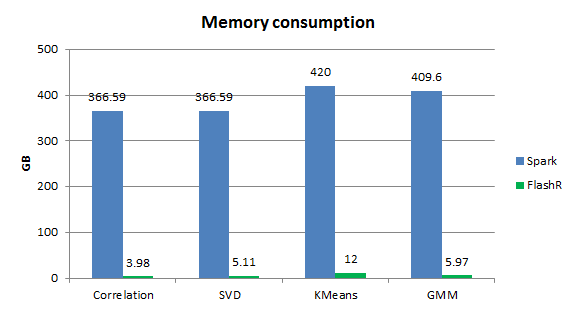
Figure 5. The memory consumption of FlashR vs. Spark MLlib on the dataset with one billion data points.
Scalability of FlashX
FlashGraph enables us to process very large graphs in a single machine. Here we demonstrate that FlashGraph can process a real-world hyperlink page graph (3.4B vertices and 129B edges) in a single machine. The table below shows the performance of the same graph applications as above. It also includes the performance of Betweenness centrality (BC) from a single vertex.
| Runtime (sec) | Memory (GB) | |
|---|---|---|
| BFS | 298 | 22 |
| Betweenness | 595 | 81 |
| Triangle | 7818 | 55 |
| WCC | 461 | 47 |
| PageRank | 2041 | 46 |
Table 3. The runtime of FlashGraph on the Page graph on HW1.
FlashGraph takes only six minutes to traverse the page graph (3.5B vertices and 128B edges) with a cache size of 4GB. Pregel used 300 multicore machines to run the shortest path algorithm on their largest random graph (1B vertices and 127B edges) and took a little over ten minutes. More recently, Trinity took over ten minutes to perform breadth-first search on a graph of one billion vertices and 13 billion edges on 14 12-core machines.
FlashGraph takes 34 minutes to run 30 iterations of PageRank on the page graph. Based on a recent talk by the main developer of Giraph, Giraph running with 20 workers can run five iterations of PageRank on a graph with 5 billion edges in approx. 75 minutes.